
3. How to Run Generate a Report
Initial Report Screen. After selecting “View Results,” a report similar to the one pictured to the right will be generated. To look at a single patient in more depth or to screen a cohort individual by individual, click on the patient alias. This will bring up a full report for each individual patient. Reports contain information on ABR Tests, Procedure History, Speech Recognition, Audiology Results and Radiology Studies.

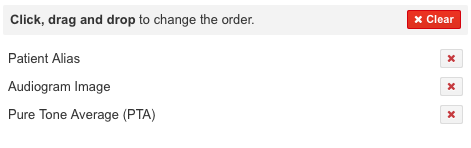
Adding Additional Columns of Data to Report. To add data columns to the report, click on the “Change Columns” button in the upper right hand corner of the web page. A new window will pop up. To browse available columns scroll down the left hand column or simply type the name of the desired column into the search box. When the user has found the column they wish to add, click on the “+” button located to the right of the desired column name. The column name will now appear under “Patient Alias” in the right hand column, as seen on the second image below. To remove a previously added column click on the “x” button located to the right of the column name you wish to remove. When all desired columns have been added select “Save” in the lower right hand corner of the screen in order to view an updated report.

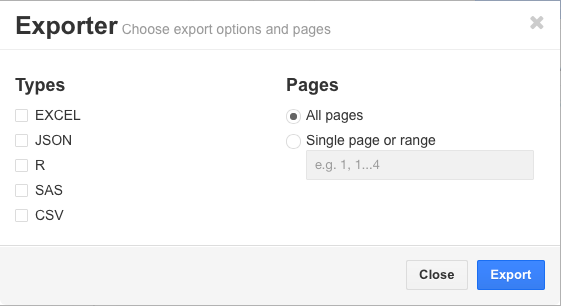
Exporting Report to a Spreadsheet. Patient lists can be exported and downloaded by clicking the  “Export” button in the upper right hand corner of the web page. The patient list will be exported with the previously selected columns, and can be exported in Excel, JSON, R, SAS, and CSV formats. The outputted data will reflect that data type that is stored in the database, or alternatively hyperlinks to the data, in cases such as images (i.e. audiograms) or patient report screens for the “Patient Alias” field.
Useful Hint: The link given for the audiogram image (i.e. ./app/plotting/audiograms/151465/small.png) shows a small version of the audiogram appropriate for the reports page, but a bit too small to use comfortably (Note: the user will need to be logged into the site to access these images). However, by changing the name of the file to medium.png (i.e. ./app/plotting/audiograms/151465/medium.png), you will get a full-sized audiogram. Furthermore, by changing the file name to large.png, you will be able to access an image with resolution appropriate for publication.
Next > Sign Up or Log In to Web App
Previous > Running a Query